
Cognos Experiment
- bozemanjr4
- Oct 25, 2021
- 7 min read
Introduction
DBJT Telecom (DBJT) is a thriving telecommunications company offering phone and internet contracts to customers throughout California, with the hope of long-term expansion into Nevada, Oregon, and Washington. DBJT is looking to acquire new customers and increase the retention of current customers to support this future expansion. Our company plans to utilize big data from customers over the past quarter to ensure that our decisions are not driven solely by personal opinion and instinct. We will analyze and utilize this data to drive our future plans for DBJT and make more informed decisions regarding customer contract offerings.
The customer team is tasked with formulating a plan to entice current and new customers, and drive the development of a positive relationship between customers and DBJT. Our team feels that if a customer stays with us for at least one year and remains satisfied, they will be more likely to continue their relationship with DBJT long-term. As it is more cost-effective to retain customers, when compared to the investment required to recruit new ones, this can lead to greater financial success for DBJT, which will be required to have a successful expansion.
DBJT is going to do this by creating innovative new deals to attract new customers, while also offering our current customers similar deals to maintain or extend their current contracts. Based on observation, DBJT has recently seen high customer churn. Investopedia defines churn as, “the rate at which customers stop doing business with an entity” (1). Our first step is determining our current churn rate, both overall and for each contract type offered. We then must learn more about why customers are choosing to cancel their contracts with DBJT and what financial impact churn is having on the company.
The team will utilize Cognos Analytics to analyze data from our current and new customers in quarter three. It is stated, “companies that figure out how to combine domain expertise with data science will pull away from their rivals” (2). DBJT will analyze churn, contract, and financial data, in conjunction with the expertise of the customer team, to make data-informed decisions. The goal is to improve customer relations and help propel the future expansion of DBJT into neighboring states.
Results
The customer team focused on a variety of data that, when analyzed, provided insights on churn rates, contract types, and why customers churn. In Figure 1, the current customer status shows that while more customers stayed with DBJT than churned, the number lost was greater than the number that joined. As we look at Figure 2, we can see that the churn rate is much higher for those on month-to-month contracts. As demonstrated in Figures 1 and 2, we found the following:
The overall churn rate is 26.5% (Fig 1)
The churn rate for month-to-month customers accounts for 89% of all customers leaving DBJT (Fig 2)
A majority of customers are on month-to-month contracts, however the churn rate is higher than the percent of customers that stayed (Fig 2)
Those on one year contracts are 88% likely to stay on as long-term customers (Fig 2)
Those on two year contracts are 99% likely to stay on as long-term customers (Fig 2)
The next piece of data, Figure 3, focuses on the average tenure of customers based on the length of their contract. This helps determine which contract type will allow us to maintain customers long-term. The overall average tenure is 32.39 months. When broken down by contract type, we found:
The month-to-month contract customers stay for an average of 17.35 months (Fig 3)
The one year contract customers stay for an average of 41.253 months (Fig 3)
The two year contract customers stay for an average of 43.916 months (Fig 3)
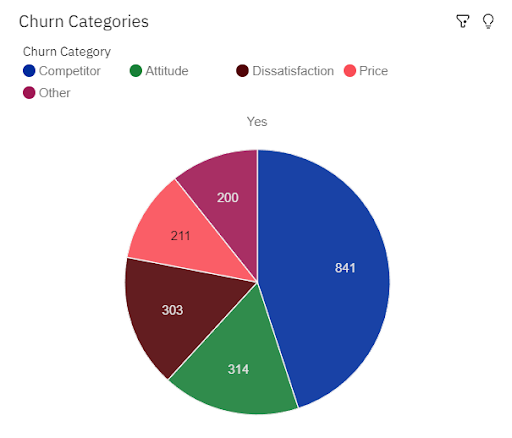
As DBJT analyzed customer reports on why they left, the data categorized the reasons into five areas, which are shown in Figure 4. Looking at the word map in Figure 5, the team was also about to analyze the more specific reasons. We found the following:
The five categories for churn include competitor, attitude, dissatisfaction, price, and other (Fig 4)
Competitors are the greatest reason for customer churn at at 45% (Fig 4)
Attitude and dissatisfaction make up 33% of the reasons for customer churn (Fig 4)
Price and other reasons make up the remaining 22% of customer churn reasons (4)
The specific top reasons for churn are that the competitor had better devices or offerings, and the attitude of a support person (Fig 5)
DBJT wants to find ways to overcome these churn reasons and build brand loyalty. As competitors are the largest reason for customer churn, the team wanted to look at this area more deeply. Figure 6 examines the four reasons for churn that fall under this category, and shows the following:
The competitor churn reasons are better devices, better offers, higher download speeds, and more data (Fig 6)
37.2% of customers that left due to competitors reported the specific reason being that competitors offered better devices (Fig 6)
36% of customers that left due to competitors reported their specific reason being that competitors having better offers (Fig 6)
The remaining 25.8% of customers that reported competitors as their reasons for leaving cited higher download speed or more data being offered by competitors (Fig 6)
After analyzing churn based on contract type and reasoning, the team needed to analyze revenue data, to see the financial effects of churn. They also wanted to look at revenue by contract type to help aid in the development of new contract plans. We found the following:
Customer churn led to a loss of $3,684,459.82 in revenue (Fig 7)
The revenue brought in by month-to-month contracts is $6,162,488.22 (Fig 8)
The revenue brought in by one year contracts is $6,171,794.31 (Fig 8)
The revenue brought in by two year contracts is $9,036,849.16 (Fig 8)
Analysis
The data analysis that Cognos Analytics was able to provide about our company, DBJ Telecom, presented a few clear signs that we will need to focus on to retain current customers and maintain new customer growth. The churn rate is much higher for those that are joining on a month-to-month basis, but the rate of new customer acquisition is also much higher. This aligns with what we already knew, the lower the commitment and risk, the more likely customers are to join. With that said, those who join on long-term contracts of one or two years are less likely to leave. There needs to be a focus on having customers sign long-term contracts, but there will have to be a “hook” to get them to commit to this with DBJT. It may also be a good idea to add an incentive for our existing month-to-month customers to entice them to sign a one or two year contract.
Cognos Analytics also informed the customer team that there are two major reasons for our customer churn, better devices or better offers. This tells us that we need to upgrade our devices to provide a better experience for our customers. We also need to create better contract terms for our customers to keep them under contract with higher satisfaction. As mentioned above, it may be a good idea to provide a more enticing offer for those that are willing to move from month-to-month to long-term contracts. This would afford DBJT with an opportunity to extend their tenure with the company and develop true customer loyalty.
There was also a mention of another top reason for customer churn, the attitude of support persons. While not related to the main category of competitors, this is also an area where the customer team at DBJT can make improvements to decrease churn and help increase the signing of new customers and growth of existing customer tenure. Providing increased training on customer service and the new contract deals, along with regular monitoring and evaluation of support staff, will help ensure customer satisfaction remains a priority moving forward.
Conclusion
The customer team recommends that DBJT implement a new strategy that focuses on long-term contracts, both one and two year. This strategy will include current month-to-month customers and new customers. It is said that, “it can cost five times more to attract a new customer than it does to retain an existing one” (3). This thinking drives the decision to include a focus on serving current customers and working to convert month-to-month contracts into one or two year commitments. In order for DBJT to be able to entice customers into signing these contracts, they must provide better devices and equipment at a competitive rate. While serving existing customers, DBJT will also offer competitive new deals that have a variety of offer and device options to serve a variety of new customers. Along with improved service, this new strategy will help decrease churn, enhance customer growth, and increase revenues for DBJT in the next quarter.
The long-term goal for DBJT is to expand outside of large cities in California and into more rural areas, as well as adjacent states. This expansion plan will be made possible by the improved customer strategy described above. Once the strategy has led to demonstrated success across multiple quarters, DBJT can turn its focus to implementing an extension plan in phases, so as to not cause the company to decline in customer churn or customer service.
Based on our unit readings, DBJT has considered two main issues when recommending these business decisions. Bringing big data to DBJT has shifted traditional thinking to data-driven decision making. We need to move away from the intuition and experience-dependent model to incorporating large data sets and the metric analytics model. In this way, we are muting our HiPPOs (2). We want our leadership to be “genuinely data-driven and willing to override [our] own intuition when the data don’t agree with it” (2).
The other issue the customer team concerned itself with is the “N=All” trap of big data (4). DBJT is committed to expand our analysis using big data from outside our company to support improved decision-making. While there is an enormous amount of relevant data that can allow us to make unit-specific inquiries, we do not assume that we have all the data. Moreover, we are very careful to consider that what we have is only a “sample” of big data. We will use critical analysis to explore our data sets and ensure confidence in the conclusions we have drawn from them. Our way of combating the “N=All” trap is by strategic partnership with other telecommunication companies in California, as well as around the country. We will gather data from all available sources to improve our market analyses and insist that our data sets contain more diverse information on which to base our future decisions, hereby creating our own big data ecosystem in the telecommunications industry (4).
References
Frankenfield, Jake, “Churn Rate”, Investopedia, March 2021, https://www.investopedia.com/terms/c/churnrate.asp
McAfee, Andrew et al, “Big Data: The Management Revolution”, Harvard Business Review, October 2012
Curi, Mariana, “Customer Churn in Telecom Segment”, towards data science, July 2020, https://towardsdatascience.com/customer-churn-in-telecom-segment-5e49356f39e5
Harford,Tim, “Big Data: are we making a big mistake?”, Financial Times, March 2014
Comments